Saturday, October 31, 2009

Correlation Of All Commodity ETFs

Here are the correlations of all commodity ETFs for the period September-October 2009.


(please click to enlarge)

As you can see, there are lots of extremely correlated ETFs. An investor will have no trouble finding substitutes. The real issue again is in finding uncorrelated commodities, here are some.

Uncorrelated

GRN and BAL have the perfect 0.0 score for uncorrelated ETFs. These are global carbon and cotton. Perfect!

UAG/SGG (agriculture and sugar)

JJT/AGF

GRN/GCC

UBC/PWND (is wind a commodity?).

SGG/PWND

These are the names of the ETFs:


Note: You may receive technical analysis and alerts of these stocks, sent automatically to you, by entering the symbols in the Technical Trend Analysis Tool, (powered by INO).

Please do your own due dilligence.

Stumble Upon Toolbar

Correlations Among All Currency ETFs and Gold

Here we go. The following table shows the correlations among all currency ETFs (plus GLD) for September and October 2009. This is extremely important for diversification of investments. It is a large image.


(please click to enlarge)

Uncorrelated Currencies

For proper diversification, what is of real interest is the uncorrelated currency ETFs. Here are the the most uncorrelated.

The Brittish Pound is the most uncorrelated currency with anything else.

-GBB with FXC (Pound, Canada, perfect 0.0 score), also with BNZ/BZF/CEZ, and similarly FXB/FXC
-YCL/CNY
-GBB/AYT (Pound/Asia)
-YCS/FXM
-YCN/CYB
-DRR/CYB
-FXY/CNY


Gold and Currency correlation:

Gold is most correlated with:

- BNZ, BZF, CEW, DBV, FXA, FXC (New Zealand, Brazil, Emerging, G10, Australia, Canada)

Gold is most uncorrelated with CYB (Yuan)


These are the names of the ETFs:


Note: You may receive technical analysis and alerts of these currency ETFs, sent automatically to you, by entering the symbols in the Technical Trend Analysis Tool.

Stumble Upon Toolbar

Stock Correlations For September and October 2009: How to Diversify Your Investments

Here are stock and major index correlations for September and October 2009. Correlations are extremely important for proper diversification of investments.

A number close to 1 indicates strong postiive correlation. A value close to -1 indicates strong inverse correlation. A number clsoe to zero indicates assets are uncorrelated.


Please click to enlarge.

The above table is based on an analysis involving all prices between September 1st and October 30.

Most correlated stocks:

- DIA/SPY

- FXA/BZF/EWZ (Australian dollar/Brazilian Real, Brazil ETF)

- FXE/UUP (Euro/USD, inverse)

- SPY/UUP

Least correlated stocks:

These are harder to find, and quite interesting

- USO and UNG (oil and natural gas!)

- USO and IWM (oil and Russel 2000)

- USO and GDX (oil and miners)

- USO and GS (Goldman Sachs, weren't they pumping oil?)

Correlations are dynamic. Past correlation does not indicate future correlation, neither does it indicate causality. However, you can compare with previous values as of the end of Q3 09 and see that typically there are only small changes over time.

Note: You may receive technical analysis and alerts of these stocks, sent automatically to you, by entering the symbols in the Technical Trend Analysis Tool.

Coming up: currency and commodity correlations

Stumble Upon Toolbar

Friday, October 30, 2009

Profit From Oil or Gold Going Up or Down

Will oil and gold move up or down? It does not matter, even if they are manipulated or not. Here are updated straddles on oil and gold, as of 3:50PM.


Computed with StraddlesCalc tool, which shows the maximum moves required to profitability.

You may receive technical analysis and alerts of these ETFs sent automatically to you, by entering the symbols in the Technical Trend Analysis Tool.

Please do your own due dilligence.

Stumble Upon Toolbar

BNN Exclusive Interview With Paul Volcker, On the Recovery, Lending to Small Businesses, Health Care


Paul Volcker today received an honorary doctorate degree from Queens University in Kingston, Ontario (a 2 hour drive from here). BNN interviewed him one on one. He discusses the economic recovery, lending to small businesses, and talks about the Canadian health care.

"He's one of the best known economists in the world - and certainly one of the most influential. BNN speaks to Paul Volcker, former U.S. Federal Reserve Chairman, and current chairman of U.S. President Obama's Economic Recovery Advisory Board".

Stumble Upon Toolbar

Japan, The Land of The Setting Sun, Will the U.S. Follow The Same Path?

There are two economies in Japan: the exporting economy (Sony, Honda, Fuji, and many other well know names), and the backnone of SMBs for the internal market. In generation from today, one in two Japanese will be retired, population will decline from 126M to 90M.

BNN interviewed Don Campbell, former Canadian ambassador to Japan, and senior strategy advisor, Davis LLP; and Derek Burney, senior strategic advisor, Ogilvy Renault, former CEO, CAE, and former Canadian ambassador to the U.S.


In Japan, there is no imminent fiscal crisis, there has been one for the last 16 years! There is deflation and a pension crisis. Will the U.S. follow a similar path?

Watch video part I, part II.

Stumble Upon Toolbar

BMO Launches 9 New ETFs: Novelties And Cannibalism at Its best

BMO has lauched 9 new ETFs this week, including some novelties, and two commodity-related ETFs (oil and base metals).

Gilles Ouellette, head of BMO's wealth management business said about ETFs: “It's a product where the margins are quite slim, so I don't think there's room for everybody.

ETFs have relatively low profit margins for a bank, but because they are so popular as investors dump the outrageosuly expensive bank mutual funds they generate trading and advice fees.

And so BMO plans to continue the expansion of its nascent ETF business, despite the risk that it could eat away at its more profitable mutual fund offerings (Financial Post).

Mr. Ouellette sdays that “there is obviously going to be a certain amount of cannibalism.” “But we expect that this product is going to grow independent of mutual funds.”

These are the new ETFs:

-BMO Short Federal Bond Index ETF (ZFS)
-BMO Short Provincial Bond Index ETF (ZPS)
-BMO Short Corporate Bond Index ETF (ZCS)
-BMO High Yield US Corporate Bond Hedged to CAD ETF (ZHY)
-BMO S&P/TSX Equal Weight Banks Index ETF (ZEB)
-BMO S&P/TSX Equal Weight Oil & Gas Index ETF (ZEO)
-BMO International Equity Hedged to CAD Index ETF (ZDM)
-BMO Emerging Markets Equity Index ETF (ZEM)
-BMO S&P/TSX Equal Weight Global Base Metals Hedged to CAD IndexETF (ZMT)

BMO's 4 existing ETFs are:

-BMO Canadian Government Bond Index ETF (ZGB), CitigroupCanadian Government Bond Index.
-BMO Dow Jones Canada Titans 60 Index ETF (ZCN), Dow Jones Canada Titans 60 Index.
-BMO US Equity Hedged to CAD Index ETF (ZUE), Dow Jones U.S. Large-Cap Index (CAD hedged).
-BMO Dow Jones Industrial Average Hedged to CAD Index ETF (ZDJ), Dow Jones Industrial Average (CAD hedged).


You may receive technical analysis and alerts of these stocks, sent automatically to you, by entering the symbols in the Technical Trend Analysis Tool, (powered by INO).

The novelties are the equal weighted ETFs, where weights are maintained so that not one individual stock takes over the portfolio. This could be a good idea. The other novelty is the currency hedging for the metals ETFs. This one is mind boggling and needs to be looked further as it could well take away all the benefits of metals going higher.

"BMO S&P/TSX Equal Weight Global Base Metals Hedged to CAD Index ETF has been designed to replicate, to the extent possible, the performance of the S&P/TSX Equal Weight Global Base Metals Hedged to CAD Index. The fund may invest in exchange-traded funds, mutual funds or institutional pooled funds, ADRs or derivative instruments. The fund exposure will be hedged back to Canadian dollars."

Stumble Upon Toolbar

SPY, IWM, XLF, AUY, UCO, EWZ Straddles Update

Here are updates on straddles posted last week.

From October 22, current ROI as of 1:30PM:


(please click to enlarge)

And these are the current ROIs from the ones posted October 19:


Note: You may receive technical analysis and alerts of these stocks, sent automatically to you, by entering the symbols in the Technical Trend Analysis Tool, (powered by INO).

Please do your own due dilligence.

Stumble Upon Toolbar

Silver Wheaton: SLW vs SLW.TO, Can You Profit From the Difference?

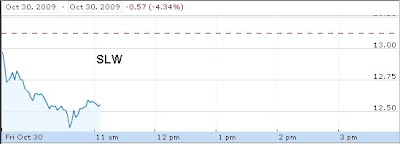
Silver Wheaton today is down 4.6% in New York (NYSE), while it is down 3.4% in Toronto (TSX). Investors may be thinking of a conspiracy, or whether it is possible to profit from this (through arbitrage).

As of 10:46AM:

- SLW was trading at $12.52, its close yesterday was $13.12: -4.6%
- SLW.to was trading at $13.52, its close yesterday was $14.00: -3.4%

The difference is simply explained by the exchange rate. The Canadian dollar as of 10:46AM was off by 1.3% versus the USD. Therefore, SLW is today worth 1.3% more in CAD, so its CAD price is higher by 1.3%. There is no magic or conspiracy here.

These charts are of around 11AM:


Stumble Upon Toolbar

U.S. Jobless Claims Are Above 500,000 For 42 Consecutive Weeks

The U.S. Department of Labor announced today that U.S. initial jobless claims were reported today: 530,000 (as of October 24), above the expected number. Says the news release:

"In the week ending Oct. 24, the advance figure for seasonally adjusted initial claims was 530,000, a decrease of 1,000 from the previous week's unrevised figure of 531,000. "


However, David Rosenberg, Chief Economist of Gluskin Sheff, today said that the stock market is currently trading at valuation levels consistent with claims of only 400,000. The peak in the 2002 recession was 517,000, and this was right after 9/11.

This has only been worse in the 1982 recession, when the claims were above 500,000 for 48 weeks. However, we have a higher population and workforce now. At that time, the government just needed to raise rates to break inflation and solve the problem a solution that is infeasible today.

Also, the median age of the boomer back then was 25, now it is 52. Credit growth at the time was accelerating, not contracting as is the case now. The situation is significantly weaker today.

Stumble Upon Toolbar

Thursday, October 29, 2009

Natural Gas Inventories at New Record High, Analysis

Natural gas inventories were released today showing a new injection of +25Bcf. The total gas in storage is now 3.76Tcf, 11.1% higher than last year.

The injection slope is, however, decreasing when compared to last year and the 5-year channel.


In theory at this rate, we are a bit less than 4 weeks to overflow. However, this indicator is no longer reliable as the injections are too small and we may already be at or near capacity.


As a result of today's numbers, UNG rose, it is a really "go figure" scenario. There is nothing rosy about natural gas. Keep in mind that prices for NG that you posted today jumped 17%, because the futures contract was changed today from November to December.


There is absolutely no activity on the radar with regards to hurricanes:


This was the only hope this summer and fall for an increase in prices, and we have had zero hurricanes hitting the production facilities.

Stumble Upon Toolbar

FSLR Dissappoints, Straddles Go Up

Here are the results of the VALE and FSLR straddles posted at 1:26PM October 27.


As of 9:40-9:45AM:


The move required on FSLR was 15%, the actual move was 16.4%. The straddle is highly profitable because there is still lots of time to expiration.

Note: You may receive technical analysis and alerts of these stocks, sent automatically to you, by entering the symbols in the Technical Trend Analysis Tool, (powered by INO).

Stumble Upon Toolbar

S&P 500 Index (SPX): The Rally Illusion

We have created a site that tracks the S&P500 index (SPX) performance in a few different currencies, with charts updated automatically on an intra-day basis.

Those living in the U.S perceive the stock markets as having gone up 14% this year. The reality is however, that those same markets have not gone down in other currencies. Here is the SPX YTD performance:

- in USD: +14.12%
- in Euros: +6.8%
- in CAD: +0.4%
- in AUD: -12.8%
- in BRZ: -19.7%

Once could argue that it is not the stock market that went up in the U.S., it is simply ther U.S. dollar that went down. The rally is an illusion. Now imagine the poor folks that had their houses drop in value in the U.S. The real losses are staggering.

We track here the index in all these currencies. Enjoy!

Note that we also maintain a site that tracks the price of gold in other currencies here.

Stumble Upon Toolbar

Martin Feldstein: It's Not "Too Big To Fail", It's "Too Connected to Fail"; GDP to Shrink


Yesterday, BNN interviewed Martin Feldstein, Professor at Harvard U., President Emeritus of the National Bureau of Economic Research (the group that calls recessions), Ronald Reagan's Chief Advisor in Economy, mentor of Larry Summer Obama's economy team.
These are some of the excellent points he made:

- There is a real risk of a double-dip recession in the U.S.
- The American consumer is in an "awful" state.
- On rates: Not a chance of interest rates going up soon, at least late 2010.
- On GDP: GDP is misleading indicator because Q3 number would be boosted by Cash for clunkers, first time home buyer subsidy. The number below could be higher than what we will see going foard. Next year GDP may well decline.
- Hardly anything good to be said about state of the consumer, there are 15 millions unemployed, 8 millions in involuntary short-time, household wealth is down $10T.
- On housing and banks: Housing sector, commercial real estate is still critical, bug burden in banks, specailly regional and smaller banks, which have to cut down in lending since they do not know how many closures and foreclosures are coming up.
- Small businesses are not able to borrow
- Commercial real estate is the key to more bank failures
- "Too big to fail" is a misnomer, the right name is "too connected to fail". Lehman was not that big.
- Stock market is overvalued, P/Es are too high.

Watch interview.

Stumble Upon Toolbar

Wednesday, October 28, 2009

SPY, IWM, AUY, KGC Straddles Results PM

Update at 3:45PM:


(kindly click to enlarge)

All positions further profitable except UCO and AAPL. AAPL is one tough cookie, but those straddles were when AAPl was $185, so timing does not match with the rest. Still, lots of time.

Stumble Upon Toolbar

Android Kills Garmin, But Garmin May Resurrect


Photo of the murderer

Shares of Tom Tom are down 21% in Europe and of Garmin are down 26% in New York as Google announces free GPS features in its Android cell phone.

Garmin has other products however.

A prime case for potential straddles.


14% max move is a little expensive.

Computed with StraddlesCalc tool.


Not advice, please do your own due dilligence.

Stumble Upon Toolbar

Has Gold Topped?

INO has a new analysis video on gold. They discuss whether gold has topped.


They are sticking to their projections and the video discusses why (it's quite nice). They see this as a good opportunity. Watch the video.

I still prefer straddles.

Stumble Upon Toolbar

SPY, IWM, XLF, EWZ, AUY, KGC Straddles Results

Here are partial results from past straddles posted here (October 19):


Please click to enlarge.

The drop in gold is causing major gains in the miners straddles. For example, the ROI in AUY is +17%, move required was 14%, move so far is 11%; the ROI in KGC is + 172%, move required was 13.3%, move so far is 19.9%.

It is clear from the above as well why I prefer IWM to SPY (+27% vs +2.3%).

The correction in EWZ was quite predictable. This is not over yet.


Note: You may receive technical analysis and alerts of these stocks, sent automatically to you, by entering the symbols in the Technical Trend Analysis Tool, (powered by INO).

Please do your own due dilligence.

Stumble Upon Toolbar

Financials Are Scary, But HIG, Hartford Financial Sees Lots of Action

Insured HIG, Hartford Financial is seeing a lot of actions in November 25 calls, with over 4,00 traded today. The company reports earnings November 3rd. Insurers have been surprising lately.

Here are straddles for it, with prices as of 11:10AM (StraddlesCalc tool).


6-month chart:


Note that we track the top financials here. HIG is not in that select group. Financials are scary today:


Not advice, please do your own due dilligence!

Stumble Upon Toolbar

Unemployment Worsens in 371 of 372 U.S. Metropolitan Areas

The U.S. Bureau of Labor Statistics has just reported that unemployment rates were higher in September than a year earlier in 371 ofthe 372 metropolitan areas and lower in 1 area.

El Centro, Calif., and Yuma, Ariz., recorded the highest unemployment rates, 30.1 and 24.2%, respectively.

Bismarck, N.D., registered the lowest unemployment rate in September, 2.9%, followed by Fargo, N.D.-Minn., 3.7%.


We hope they don't just chop the unemployed into the wood chippers there.

Thirteen areas recorded jobless rates of at least 15.0%, while 12 areas registered rates below 5.0%. The national unemployment rate in September was 9.5%, not seasonally ad-justed, up from 6.0% a year earlier. Among the 369 metropolitan areas for which non farm payroll employment data were available, 359 areas reported over-the-year decreases in employment, and 10 reported increases.

Detroit-Warren-Livonia, Mich., recorded the largest jobless rate increase from September 2008 (+8.4%), followed by Muskegon-Norton Shores,Mich. (+6.8%. An additional 5 areas registered unemployment rate in-creases of 6.0% or more, and another 34 areas had increases of 5.0 to 5.9%.

Access report here.

Stumble Upon Toolbar

USO Backtesting of Daily, Weekly, and Monthly Alerts

Speaking of oil, I ran USO through the Trade Alert tool (INO), backtesting all results on monthly, weekly, and daily alerts.

Monthly alerts:


Weekly alerts:


Daily alerts:


Here is the performance:


(please click to view)

- Monthly: ROI 158.3% (vs buy & hold ROI of -45.1%)

- Weekly: ROI 123.9% (vs buy & hold ROI of -44.1%)

- Daily: ROI 46.9% (vs buy & hold ROI of 44.6%)

Overall, these are pretty good results, particularly for the monthly and the weekly.

Note that the daily includes a winning trade at the beggining. Even if we exclude this trade, the ROI is still quite positive.

You can access the tool here (link for free trial), or just get the alerts emailed to you on any symbol you enter here (not real-time). INO also has a free trading course. Please do your own due dilligence!

Stumble Upon Toolbar

Profit From Oil Going Up Or Down

Oil above $80 will choke the weak economic recovery in the U.S., yet, the near-collapse of the U.S. dollar may continue, and a major market correction is coming. Oil has forces pushing it up and down. Which one will prevail?

Nobody knows. This is another situation for using straddles, which allow the investor to profit when the underlying stock moves iether way, as lng as it moves. Below are the November and December plays for to very popular ETFs: USO and UCO (our favorite as it has much higher volatility). UCO is a leveraged version.

The straddles were computed with StraddlesCalc tool.


(please click to enlarge)

The maximum moves required for profitability are shown. Actual moves needed may be smaller as we still have over 20 days to expiry.

You can follow the movement with these particular options over the last 30 trading days here:


We also track all oil ETFs here.


Not advice. Please do your own due dilligence. Options are very dangerous and may cause 100% loss if used incorrectly.

Stumble Upon Toolbar

Live Tracking of All 115 Leveraged ETFs On the Market

Here is a brand new "Live Tracking" site for tracking all leveraged ETFs on the U.S and Canadian markets (the ones that are trackable).

Access site.

The list includes 115 2X and 3X bull and bear ETFs. As usual, it shows daily and YTD performance and charts.

Note: You may receive technical analysis and alerts of these stocks, sent automatically to you, by entering the symbols in the Technical Trend Analysis Tool, (powered by INO).

Stumble Upon Toolbar

Tuesday, October 27, 2009

The Lithium Bubble: One Company's Lithium Reserves Will Last Hundreds of Years


Salar de Atacama: World's Largest Reserve of Lithium

Sociedad Quimica Minera of Chile trades as ADR SQM on the NYSE. The company has the largest reserves of Lithium in the world. It has lots of it, and with very high grade. In fact, it has supply for hundreds of years even considering the best optimistic scenarios for electric car production.

Here are a few charts from their analyst update in January 2009.

Lithium demand:


Lithium sources and concentration:


Salar de Atacama Details:


Lithium supply:


SQM chart:


(please click to enlarge)

SQM's RSI values are 48.05 (daily), 56.67 (weekly), 69.7 (monthly). The monthy is too high for comfort.

------

On the lithium bubble:

The theory, which has seen shares in lithium stocks double and triple over the past few months, is that cars such as the Chevrolet Volt and the Nissan Leaf will trigger a massive increase in the demand for lithium-ion batteries.

Says DryBlower, a mining site:

"Leight Clifford, a Rio Tinto hero long before Stern Hu snatched that claim to fame, once famously said he wasn’t interested in “mining the periodic table”. That might be one reason why Rio Tinto’s name is not associated with the latest speculative boom to grip stock markets around the world – lithium. Another reason is that lithium might easily turn out to be a member of a passing parade of metals that have their 15 minutes of glory, before exiting stage right never to be heard of again. Classic signs of irrational exuberance about an ultra-light metal which might have a bright future in the electric car industry.

Right now, and time is important for red-hot lithium stocks, it appears that lithium-ion is the battery of choice for car makers because it is light and stores a lot of electricity.
The second belief driving the lithium boom is that the world doesn’t have much of the stuff and a shortage of supply will push the price through the roof.

Dear, oh dear! Where were these children trading in lithium shares when we had a gallium boom because it was the metal for computer chips, hafnium for nuclear fuel rods, or scandium for aluminium alloys and golf clubs? Dryblower has been around long enough to remember each of these booms, plus a few more such as scheelite in the 1950s, and vanadium (every 10 years).
The point about this trip down memory lane is not merely to demonstrate that there are a lot of elements on the periodic table, but that every one of them has a use somewhere, sometime.
The real issue is that very few, apart from the commonly traded metals such as copper, nickel and zinc, have a depth of market sufficient to justify a mine development, or that there is actually a shortage of supply (or booming demand) to ensure high prices for the life of a mine.
Gallium is a Dryblower favourite. Back in the 1980s (or perhaps it was the 70s), the big French chemical company, Rhone Poulenc, bowled into Australia and announced a joint venture with Alcoa to extract the gallium from the liquor circuit streaming through the Pinjarra alumina refinery.

The Frogs spent $50 million on their gallium plant. Operated it for a few months, and then closed it. Why? Because the world market for gallium arsenide dried up, and better (and cheaper) metals came along for computer chips.

This is the big issue confronting lithium today. No one, not even Dryblower can say that lithium does not have a future as a metal for the electronics industry, or for the potential boom in electric cars. But, there are issues to consider, and they include: How much lithium does the world want? How much is currently produced, where and by whom? What is the world’s recoverable lithium resource? The last time these questions were asked they applied to magnesium, which was also a metal set to revolutionise the world’s vehicle industry – but didn’t.

Hundreds of millions of dollars was tipped into magnesium production, until investors woke to the fact that the world used about two ship loads a year, and car makers wouldn’t switch until supply increased, and miners wouldn’t boost output until demand increased.
If Joseph Heller hadn’t written Catch 22 about the logic (or lack of it) about the bureaucratic world as seen in the US Air Force then the magnesium conundrum would make a perfect novel about lunacy.

Is lithium going to be a repeat? Well, the numbers aren’t too encouraging. According to local lithium leaders such as Galaxy Resources, the world currently uses 110,000 tonnes of lithium a year, likely to rise to 300,000t in 10 years.

Salar de Atacama, a single salt flat in Chile, is estimated to contain a resource of between 7.5 million and 35.7 million tonnes of lithium. Described as “the Saudi Arabia of lithium”, that lower number of 7.5Mt represents 68 years of supply at today’s rate of consumption, and 25 years at the forecast rate of demand in 10 years time. At the upper resource estimate Salar de Atacama contains 324 years of current demand and 119 years of forecast demand in 10 years.
Dryblower suspects the point is made because Salar de Atacama is just one source of supply, production can be easily increased, and alternative sources developed.

Perhaps Galaxy, with a project located in politically stable Australia, will be one of the new suppliers – this is why its share price has risen by 400% over the past year to a 12-month high of $A1.50 last week – and perhaps it will not".

Watch BNN video.

Stumble Upon Toolbar

ETNs vs ETFs

ETNs, Exchange Trade Notes, and ETFs, Exchange Traded Funds, are very similar instruments, yet they have a significant difference.

Similarities:

- Both follow an index or a basket of stocks traded in an exchange, so can be traded freely on an intra-day basis (unlike mutual funds which investors can only trade at the end of the day).

- Both have very low fees

Differences:

- ETFs are structured like a mutual fund, you own a piece of the fund, and the corresponding number of shares in the companies or contracts it invests in (in the case of commodities)

- ETNs, on the other hand, are structured as debt, baked by a bank, so there is credit risk. If the bank goes under, so does that ETN. An example are the three ETNs issued by Lehman Brothers in February 2008: Opta S&P Listed Private Equity Index Net Return ETN , Opta Lehman Brothers Commodity Index Pure Beta Total Return ETN and Opta LBCI Pure Beta Agriculture Total Return ETN. You know what happened to Lehman Brothers. As they are treated as debt, in December 2007, the U.S. IRS issued an adverse tax ruling on currency linked ETNs. The rule stated that any financial instrument linked to a single currency regardless of whether the instrument is privately offered, publicly offered or traded on an exchange should be treated like debt for federal tax purposes. This means that any interest is taxable to investors, even though the interest is reinvested and not paid out until the holder sells any such financial instrument, including an ETN, or the contract, matures.

- In theory, ETFs have market risk, while ETNs have market and issuer risk.

Risk.

The Nasdaq states that "Exchange Traded Notes have hidden risks not found in standard Exchange Traded Funds, but they have greater flexibility than ETFs and give investors efficient access to niche markets poorly suited to ETFs. Understanding this risk/reward ratio is the key to ETN investing.ETNs are unsecured debt from their issuer, not direct ownership of stocks, bonds or other assets like ETFs. So if the provider goes bankrupt, investors end up holding the bag. This was the case with Lehman Brothers, whose three ETNs shuttered upon its demise".

Liquidity:

In terms of liquidity, ETFs are 10x larger

- ETNs: $5.6B in assets
- ETFs: $60B in assets

Largest ETFs:

1. SPDRs SPY, 70.73B
2. SPDR Gold Shares GLD, 35.05B
3. iShares MSCI EAFE Index EFA, 34.37B
4. iShares MSCI Emerging Markets Index EEM, 33.74B
5. iShares S&P 500 Index IVV, 20.44B
6. PowerShares QQQ QQQQ, 17.09B
7. iShares Barclays TIPS Bond TIP, 16.31B
8. Vanguard Emerging Markets Stock ETF VWO, 14.10B
9. iShares iBoxx $ Invest Grade Corp Bond LQD, 13.33B
10. iShares Russell 2000 Index IWM, 13.14B
11. Vanguard Total Stock Market ETF VTI, 12.35B
12. iShares Barclays Aggregate Bond AGG, 10.62B
13. iShares Russell 1000 Growth Index IWF, 10.42B
14. iShares MSCI Brazil Index EWZ, 10.17B

Largest ETNs:

1. Barclays iPath Dow Jones AIG Commodity Index (DJP)
2. Powershares DB Crude Oil Double Long (DXO)
3. Barclays iPath S&P GSCI Crude Oil (OIL)


Summary

In other words, ETNs act as bonds that don’t pay interest at a fixed rate, but pay a return on a given index. ETNs are typically registered under the Securities Act of 1933.

ETFs are regulated by the Investment Company Act of 1940, ensuring some protection of the assets of the ETF in the case the issuer goes bankrupt. This is not the case with ETNs, which are debt instruments only as good as the credit of the issuer. In other words, if the issuer goes under, your money is lost.


When you buy an ETN, such as OIL from Barclays, you get a promise that it will perform as stated (i.e., the performance of the Goldman Sachs Crude Oil Return Index). When you buy the USO ETF, you actually own some futures contracts on barrels of oil. If the fund manager goes under, shares should contunue to trade or your money will be exchanged for the shares, at least in theory.

Stumble Upon Toolbar

Icici Bank (IBN) Down Sharply Today


We track the top financial institutions here.

Icici Bank, symbol IBN, is down heavily today as you can see from the chart above. This is why these charts are so useful. These financials lead the market.

Singapore state investor Temasek has cut its stake in Icici, India's second-biggest lender, to 5.76 percent as of September 30 from 7.6 percent at the end of June, Bombay Stock Exchange data showed. The Government of Singapore Investment Corp., the city-state's bigger fund, also trimmed its stake in ICICI (IBN) to 1.53 percent at the end of September from 1.66 percent at the end of June.

Red daily alerts were issued for Icici on Octover 21:


(please click to enlarge)

Here is the performance of the above alerts, as per Ino's alert tool. The down trend was beautifully indicated (green is buy, red is sell above):


Above is the performance of $10 invested on Jul 6 2009, following each alert, compared to a Buy and Hold strategy: +27.5% versus +5.5%, not bad.

(Access free trial to tool through this link).

Stumble Upon Toolbar

First Solar and Vale Report Earnings: Options

Here are straddles for First Solar and Vale, which report earnings tomorrow:


The positions are computed with the StraddlesCalc tool, and indicate the maximum moves required for profitability. That is a hefty move for FSLR, which is down today almost 4% on SunPower's (SPWRA) weak outlook (-14% on Friday). RBC Capital Markets analyst Stuart Bush cut SunPower to "sector perform" from "outperform".

This is not advice. pleae do your own due dilligence. Options are very dangerous and may cause 100% loss.

Stumble Upon Toolbar

Roubini and the Carry-Trade Bubbles, Where Has He Been?

Bloomberg reports that New York University professor Nouriel Roubini is warning about a commodities bubble fueled by the U.S. dollar carry trade. One wonders where he had been lately. This is what we were discussing over the last couple of months.

We track all commodity ETFs in the market here.

Roubini says the bubbles that may spark another financial crisis as we have “the mother of all carry trades,” “Everybody’s playing the same game and this game is becoming dangerous.”

He also said said the dollar will eventually “bottom out” (really??) as the Fed raises borrowing costs and withdraws stimulus measures including purchases of government debt. That may force investors to reverse carry trades and “rush to the exit,”. “The risk is that we are planting the seeds of the next financial crisis,” “This asset bubble is totally inconsistent with a weaker recovery of economic and financial fundamentals.”

Does Dr. Roubini know that the top commodity ETF YTD is one that tracks lead? From the above tracking site:


(please click to enlarge)


In all fairness, we do not know why or how he made these declarations. It would all be the medias' fault as they pressed him for any declaration, thus he stated the obvious.

Stumble Upon Toolbar

China Again Says Reverve Currency Should Move Away From U.S. Dollar

The People's Bank of China erlseased a report on Monday which says that country should increase the amount of currencies in its reserves, besides the U.S. dollar, in the Financial Times newspaper, which is published by the Chinese central bank.

However, these reports should be taken with a grain of salt as the bank is known for issuing reports to gauge public opinion. For now, it is just that, a report, and does not mean policy.

Several Chinese officials however, have expressed concerns about the U.S. dollar, which as we know has nearly collapsed this year. From our Live currency traking site which tracks all foreign currency ETFs on the market:


(please click to enlarge)

The U.S dollar rebounded sharply yesterday though, so the comments were not taken too seriously, or at least did not have much effect. Please see our article yesterday.

Here are the daily alerts on the U.S dollar index:


Stumble Upon Toolbar

Forget Gold and Oil: Soft Commodities Are Skyrocketing; Cocoa, Sugar, and Coffee - How to Invest in Them

Please note that we track all commodity ETFs here.

The collapse of the US dollar has caused not only oil and gold to soar but also soft commodities. In particular, cocoa, sugar, and coffee have risen sharply lately. In addition to the USD issues, there are supply constraints due to political problems (cocoa), weather-related and tariffs (sugar).

Since people need to eat, so from that point of view, these soft commodities may have a lot further to go up than oil and gold. Oil and gold are also extremely manipulated by speculators. This is not today, that the speculators may not move to soft commodities as well (they already started).

Cocoa is hitting 30-year highs, and coffee is hitting a 13-month high.


Coffee

Once considered luxury iteam in China and India in the past, now people have experienced them, and want them, so demand is much higher. There are coffee shops all over the place already in China.Coffee should climb into next year, depending on dollar weakness. Interestingly, Vietnam is now the world's 2nd largest coffeee (20M bags) producer ahead of Colombia (10M bags). Unfortunately, today it is commodity funds that are making the market, not supply and demand.

Says Wikinvest: "The biggest consumers of coffee are developed countries such as the United States, Germany, and Italy, which account for the majority of worldwide coffee imports, but on a per capita consumption basis countries such as Finland, Aruba, and Iceland lead the pack. Meanwhile, in emerging markets like Brazil, Vietnam, and Colombia, coffee is a major source of revenue, with exports of coffee accounting for, in some cases, over 80% of foreign exchange earnings.

Some companies affected by coffee prices:

Starbucks (SBUX)
Kraft Foods (KFT) - Maxwell House
Procter & Gamble Company (PG) - Folger's
Nestle (NSRGY)
Sara Lee (SLE)
Tim Hortons (THI)
Peet's Coffee & Tea (PEET)
Dunkin Donuts

Production:


The ETF that tracks coffee is JO:


Ino's buy/sell alerts on Coffee Dec 2009 and Dec 2010 contracts:


(click to enlarge)


Sugar


Sugar is well below is all-time high. There is lots of upside potential. Major producing countries are India and Brazil. Sugar cane is of cource also used for bio-fuels s the majority of cars in Brazil run on Ethanol.


Says Wikinvest: "Around 160K metric tons of sugar are produced every year,with the largest producers in Brazil, India and the European Union. The primary driver of sugar prices is government regulation. Many governments heavily subsidize their sugar manufacturers, to "dump" cheaply-priced sugar in the market, while the United States government has tried to elevate prices within its borders by imposing import restrictions. Since sugar is a good source for ethanol production, oil prices and the demand for ethanol are also impact the international price of sugar; for example, in the first half of 2008, sugar prices increased by more than 20% in response to rising gasoline prices".

Ino's buy/sell alerts on May 2010 contracts:


Production:


The ETF that tracks sugar is SGG:


Cocoa

Chocolate lovers may be in a for a shock. Cocoa is currently at a 30 year high. The Ivory Coast is part of the problem and there is no stability coming to the region any time soon. Farmers make $3,200 yearly income for 1 ton of cocoa they produce on average. That is their annual income (less intermediary fees)

The top 5 cocoa producing nations are: Ivory Coast, Ghana, Indonesia, Nigeria and Cameroon,

Says Wikinvest: "Americans consume about 3 billion pounds of chocolate annually, but consume less per capita than Europeans. Sixteen out of twenty of the top chocolate consuming countries (per capita) are European. Chocolate consumption is seasonal. People tend to consume more chocolate during Winter time. Prices for chocolate have nearly doubled since 2006, due to crop shortages, and increased consumption of chocolate (especially of dark chocolate, which requires more cocoa)".
Production:

The ETF that tracks cocoa is NIB:


Ino's buy/sell alerts on Dec 2009 and Dec 2010 contracts:


(You may use INO's trade tool via a free trial through this link, it has all or most of the commodities and ETFs you can imagine).

Stumble Upon Toolbar

Financial TV

Blog Archive

// adding Google analytics