I received some requests for examples and results of RSI analysis from our new tool. Here are some.
Nokia, NOK
Standard RSI7, 30/70:
(please click to enlarge images)
For NOK the Buy alert success rate after 30 days is 66%. The sell alert success rate is 50%. After 400 days the success rate is 66% for buys, and 90% for sells.
Nokia RSI, 9 28/60 (Buy optimal):
Now the Buy success rate after 30 and 240 days is 80%.
RSI13, 20/76, sell success rises to 100% (sell optimal):
Sell success rate after 30 days and 240 days is 100.0%
USO:
Buy success: 72%, sell success: 64%
RSI5, 20/60 (buy success: 100%):
RSI7, 20/78 (sell success: 75%/100%):
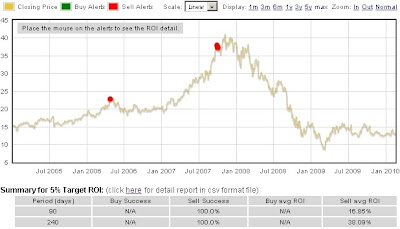
VIX:
RSI7, 30/70:
That is pretty good.
RSI11, 38/60 (sell success 100%, sell ROI 30/39% for holding 90/240 days)

NTRI
RSI 7, 30/70:
RSI5, 22/78 (buy optimal):
RSI5 28/80 (sell optimal):
Goldcorp, GG
RSI7, 30/70:

RSI5, 28/80 (Buy optimal)

RSI7, 20/80 (sell optimal):

RSI7, 30/70:

RSI 7, 20/60 (Buy optimal)

RSI5, 20/72 (Sell optimal):

For requests of other stocks or early access to the tool, please submit a comment or email me.


1 comment:
SI,
Great job. A tool like this could make me a long term holder of equities again. As probably yourself, I can think of limitless uses for this tool. One example, if the # correlate, is having set optimal RSI buy and sell signals for sectors or classes of stocks. Materials have one optimal level. Where small caps another. Thanks again for your hard work.
Bobbyo
Post a Comment