

TLT has dropped considerably in the last couple of weeks, and treasury yields have increased.
I plotted the yields of US Treasuries, from 3 month to 30 years, since the middle of 2009, until last Friday:
(please click to enlarge)
The yields have clearly been rising in recent weeks, which is reflected in the poor auction results.
Shall the yields continue to rise, we can expect a further drop in certain bond ETFS such as TLT, and rise of inverse ETfs such as TBT. The Fed has however said that interest rates will not rise, but those are only the ones they control, which are short term rates.
Note however, that the low in yields for the 10y and 30y was around Oct 4th, which corresponds to the local high on TLT.
Please see last week's post on this subject and how to play this situation.
This chart compares TLT and TBT: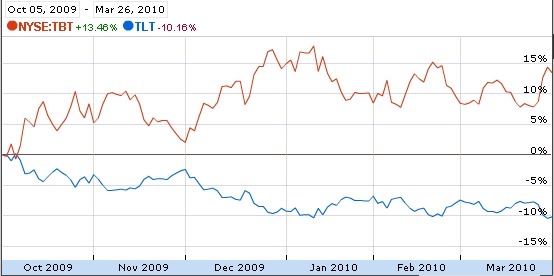
TLT:
TBT:


No comments:
Post a Comment